#6222 closed defect (fixed)
Very bad vertical axis scale with log Y
| Reported by: | massimo ceraolo | Owned by: | Adeel Asghar |
|---|---|---|---|
| Priority: | high | Milestone: | |
| Component: | OMEdit | Version: | 1.16.0 |
| Keywords: | Cc: |
Description (last modified by )
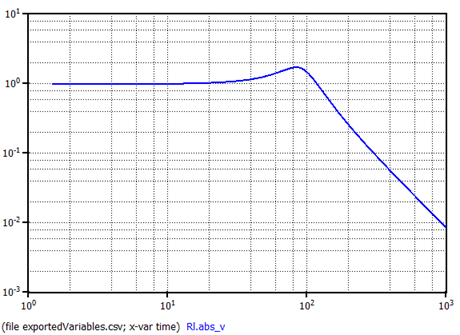
Consider the enclosed Filter.mo model. Run it and plot Rl.abs_v against time on a linear scale: we see that the span of abs_v is between 0.00026 and 4. When we switch to logY scale therefore we expect the y axis span to be between 10-4 and 101.
Instead, it goes from 1e-100 to 1e-20, which is very bad.
Attachments (3)
Change History (10)
by , 6 years ago
comment:1 by , 6 years ago
| Description: | modified (diff) |
|---|
comment:2 by , 6 years ago
comment:3 by , 5 years ago
| Milestone: | 1.17.0 → 1.18.0 |
|---|
Retargeted to 1.18.0 because of 1.17.0 timed release.
comment:5 by , 5 years ago
I remember discussing the "difficulty" of creating good log scales, in which I read that even Dymola is not good at this. This discussion was on a different ticket, which I cannot find now.
I want to share here my code that is compact, simple, and works well, as you can see from the pictures pict1.png and pict2.png. I hope it may help to find fast a solution to this ticket.
In the code below I added some additional lines of comment to make it clearer what the data structures contain.
  /* Before this code I must have determined minimum and maximum values of the variable that should be
   *  represented by the axis: minVal and maxVal.   */

  if(myAxis.scaleType!=stLin){  //This is to select casesw iwhen I have decibel o true log scale
    if(maxVal<=0 || minVal<=0){ //minVal and maxVal are minimum and maximum values to be included in axis range
      if(myAxis.type==atX)
        msg="Cannot create a log scale on the x-axis\n"
            "because the range contains null or negative values\n\n"
            "Please change the variable to be plot, or the x-axis range or choose a linear scale";
      else
        msg="Cannot create a log scale on the y-axis\n"
            "because the range contains null or negative values\n\n"
            "Please change the variable to be plot, or the y-axis range or choose a linear scale";
      QMessageBox::critical(this, "MC's PlotXWin",msg,QMessageBox::Ok);
      return 1;
    }

    sprintf(buffer,"%+10.3e",double(minVal));
    sscanf(buffer+7, "%u", &myAxis.eMin);
    sprintf(buffer,"%+10.3e",double(maxVal));
    sscanf(buffer+7, "%u", &aux);
    /* If maxVal is not a power-of-ten, eMax=Aux+1, otherwise eMax=Aux*/
    buffer[6]=0;
    if(strcmp(buffer,"+1.000")==0)
      myAxis.eMax=aux;
    else
      myAxis.eMax=aux+1;
    myAxis.scaleFactor=1.;

    // *** The following two rows are the core of my technique to determine axis extrema ***
    myAxis.scaleMin=powf(10.,myAxis.eMin);
    myAxis.scaleMax=powf(10.,myAxis.eMax);
    // ***

    if(myAxis.scaleType==stDB){  //scale in DB: decibels
      sprintf(buffer,"%d",20*myAxis.eMin);
      myAxis.maxTextWidth=myPainter->fontMetrics().width(buffer);
      sprintf(buffer,"%d",20*myAxis.eMax);
      myAxis.maxTextWidth=qMax(myAxis.maxTextWidth, myPainter->fontMetrics().width(buffer));
      sprintf(buffer,"dB");
      if(useBrackets)
        sprintf(buffer,"(dB)");
      myAxis.maxTextWidth=qMax(myAxis.maxTextWidth, myPainter->fontMetrics().width(buffer));
    }else{// myAxis.ScaleType=stLog, and true logarithmic scale
        aux=myPainter->fontMetrics().width("10");
      sprintf(buffer,"%d",myAxis.eMin);
      myPainter->setFont(expFont);
      myAxis.maxTextWidth=aux+myPainter->fontMetrics().width(buffer);
      sprintf(buffer,"%d",myAxis.eMax);
      aux+=myPainter->fontMetrics().width(buffer);
      myAxis.maxTextWidth=qMax(myAxis.maxTextWidth,aux);
      myPainter->setFont(numFont);
    }
  }
I can confirm this, it was also the case in 1.14.x
Furthermore, the user-settings for min/max value of the log scale are ignored/ lead to display errors