Opened 7 years ago
Closed 3 years ago
#5447 closed enhancement (fixed)
Automatically pick the right prefix for units in OMEdit plots
| Reported by: | massimo ceraolo | Owned by: | Adeel Asghar |
|---|---|---|---|
| Priority: | blocker | Milestone: | 1.21.0 |
| Component: | OMEdit | Version: | 1.18.0-dev |
| Keywords: | Cc: |
Description
A few years ago, I made a proposal of using standard prefixes for plots, that was not accepted because the tool used to draw plots had not this capability.
Now OMEdit has improved a lot, and, in my opinion, the need of better visualisation of scales is more prominent. Therefore I formulate a new proposal that does not require any special feature of the plotting tool.
The presence of a drop-down menu for Display Unit of all plot variables, helps a lot.
What I propose is a smart scaling feature that avoids, as default, the writing of numbers in exponential form in the vertical axis as follows:
- Whenever a variable has its absolute maximum above 1000 and below 1000000 show that variable with “k” prefix. For instance, if we have a max power equal to 20000 W, or a min power equal to -30000W power is to be showed in kW instead of W. The Display Unit menu would have as choices “W” and “kW"; so that if one (not me!) prefers, for some reason, the display in exponential form, he can;
- Whenever a variable has its absolute maximum below 0.1 and above 0.0001 show that variable with “m” prefix. For instance, if we have a max power of 0.005 W (or a min power of -0.005 W), show it in mW. The Display Unit menu would have as choices “W” and “mW"; so that if one prefers, for some reason, the display in exponential form, he can;
- Use the same pattern in the above points 1 and 2 also for larger and smaller values, so that prefixes between “f” (“femto”) and “P” (peta) are used
- If a variable has its absolute maximum above 1018 or absolute minimum below 10-16, show it using the unit without prefix (in exponential form)
In addition to the points 1 to 4 above, I propose the following special cases:
- For angular speeds always add in the menu in the unit column, in addition to the standard “rad/s” also “rpm”
- For energies always add in the menu in the Display Unit column, in addition to standard “J”, also “Wh” (both with and without prefix, the prefix, if needed, being chosen according to the rules 1 to 3 above)
I understand that the rules that I propose are somewhat arbitrary. However, IMO something needs to be done, and I created this proposal in the effort of suggesting good ideas, that can be enhanced with discussion and tests on a prototype implementation.
Attachments (15)
Change History (63)
comment:1 by , 7 years ago
comment:2 by , 6 years ago
It should also be much easier to change the units of a specific curve. Currently, you can change the unit in the variables browser only, and in most cases there are not many alternatives (for example, if I have a voltage variable, I only see 'V', while I don't see 'mV', 'kV', and 'MV'. We should have more units with prefixes there, an also give the opportunity of changing the unit by selecting the variables in the legend at the top of the plot.
comment:3 by , 6 years ago
If the technique indicated in this ticket is implemented in the right way, I expect (nearly) nobody will have to manually select mV, kV or V, since the most reader-frendly unit is automatically chosen.
(Ceraolo is speaking. I'll have to reset the password since Google told me that the previous one was exposed, but I don't know how to do this)
follow-up: 7 comment:5 by , 6 years ago
@adeas31, as I see it, we are not displaying the units on the axis, but only in the legend.
This is actually good, because one may plot variables with different units on the same graph (whether this makes sense is another story).
So, we can keep the axes exactly as they are today, and just figure out the range of each variable, multiply it by the appropriate power of 103 and then display it, with the corresponding prefix (micro, milli, kilo, mega, etc.) on the legend of that variable. That's it.
I would probably make this feature optional so you can disable it if you want, because there could be some corner cases where this doesn't look nice.
comment:6 by , 6 years ago
| Summary: | Try to avoid using numbers in exponential form on vertical axes → Automatically pick the right prefix for units in OMEdit plots |
|---|
comment:7 by , 6 years ago
Replying to casella:
@adeas31, as I see it, we are not displaying the units on the axis, but only in the legend.
This is actually good, because one may plot variables with different units on the same graph (whether this makes sense is another story).
So, we can keep the axes exactly as they are today,
In case all the curves share the same dimension, it would be much better to use the unit on the axis, since it is a well established standard. I expect this to be a very common case I would therefore recommend to use the solution proposed on comment 5 only for the case the plots are in homogeneous. (Comment by ceraolo)
comment:9 by , 6 years ago
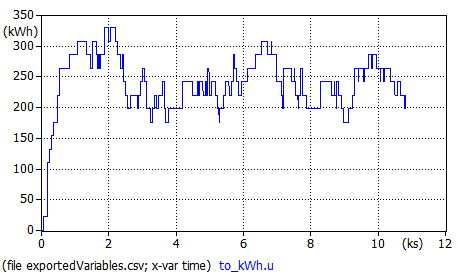
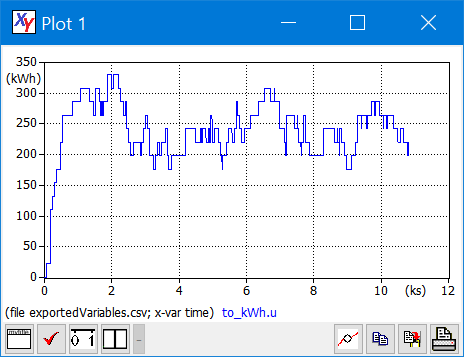
When this ticket is addressed, please consider also reducing the font size (and/or the number) of the labels on plots, especially when plots are small, both on screen and when saved on disk.
To clarify what I mean I made a comparison using the same data between OMEdit and my plotting/postprocessing program PlotXY: results are in exported XY, exportedOM, screenXY, screenOM.
by , 6 years ago
| Attachment: | exportedXY.png added |
|---|
by , 6 years ago
| Attachment: | screenXY.png added |
|---|
by , 6 years ago
| Attachment: | screenOM.png added |
|---|
by , 6 years ago
| Attachment: | exportedOM.png added |
|---|
comment:10 by , 5 years ago
@ceraolo can you send me an example model that I can play with.
This particular issue is also discussed in #2696.
by , 5 years ago
| Attachment: | TestUnitMultiples.mo added |
|---|
comment:12 by , 5 years ago
@adeas31, the attached example contains variables with voltages of various magnitude. OMEdit should pick the right unit (pV, nV, uV, mV, V, kV, MV) depending on the magnitude of the largest signal that you are visualizing in a single plot, so that the numbers on the Y axis are preferably within the range 1-1000.
by , 5 years ago
| Attachment: | with-prefix.png added |
|---|
by , 5 years ago
| Attachment: | without-prefix.png added |
|---|
by , 5 years ago
| Attachment: | PlotXY64.exe added |
|---|
by , 5 years ago
| Attachment: | TestUnitMultiples2.mo added |
|---|
comment:14 by , 5 years ago
This is a good starting point. To discuss better I've uploaded as TestMultipleUnits2.mo, an updated version of TestMultipleUnits.
Moreover, I uploaded PlotXY.exe, which is a program I've been improving for 20 years, and for this is tested in so many different conditions. This program is able to read OpenModelica output (.mat) of TestMultipleUnits2, and therefore can give a good idea of the expected behaviour.
To use it, just load the file (using load or dragging & dropping), clicking on the variable to plot and click on the plot button.
Some points on today's implementation
- Seeing "kilo" on the vertical axis and (V) on the quantity is a little better than the previous behaviour, but for me insufficient. Scientists and engineers use nF, mF kV, MW, GW, etc., not "nano" "kilo " associated with the un-prefixed unit. In case of multiplication, the dot can be added: kWh or kW.h are good at the same level
- since Modelica is from its ground-up unicode compliant, I think time has come to use greek letters when needed: greek-omega fo ohms, greek-mu for micro. I did this on my PlotXY, with Qt, and was straightforward.
- since we are doing the job, better doing it for good. I propose to include a larger scale of prefixes. In the ticket's description, I mentioned between “f” (“femto”) and “P” (peta), which is good for me. I would not object if more exotic prefixes are used, e.g. going down up to "atto" and up to "exa". Finally, I would not recommend deeper prefixes, down to yocto (10e-24) and up to yotta (1024).
- variable v13 is displayed wrong
- some variables, such as v_2, v_3 and v_4 are not nice to see (the latter the worst). This is my guilt since my ticket description was faulty. Sorry for this. Please check the appearance with PlotXY. You can use it to create plots, or consider the enclosed images (screens.pdf). I hope that switching to a more PlotXY-like behaviour is straightforward for you.
by , 5 years ago
| Attachment: | screens.pdf added |
|---|
comment:15 by , 5 years ago
I also wanted to comment: having the prefix on the y axis (e.g. kilo) and then the legend saying (V) is a bit confusing. It would be a lot better to have (kV) in the legend.
follow-up: 19 comment:16 by , 5 years ago
See PR#7405. I will look forward for more feedback.
Seeing "kilo" on the vertical axis and (V) on the quantity is a little better than the previous behaviour, but for me insufficient. Scientists and engineers use nF, mF kV, MW, GW, etc., not "nano" "kilo " associated with the un-prefixed unit. In case of multiplication, the dot can be added: kWh or kW.h are good at the same level
I removed the words and added prefix letters to actual name in legend rather than on axes.
since Modelica is from its ground-up unicode compliant, I think time has come to use greek letters when needed: greek-omega fo ohms, greek-mu for micro. I did this on my PlotXY, with Qt, and was straightforward.
I believe we should have a different ticket for it.
since we are doing the job, better doing it for good. I propose to include a larger scale of prefixes. In the ticket's description, I mentioned between “f” (“femto”) and “P” (peta), which is good for me. I would not object if more exotic prefixes are used, e.g. going down up to "atto" and up to "exa". Finally, I would not recommend deeper prefixes, down to yocto (10e-24) and up to yotta (1024).
Is now from femto till peta. The deeper prefixes are also possible if needed.
variable v13 is displayed wrong
Should be fine now.
some variables, such as v_2, v_3 and v_4 are not nice to see (the latter the worst). This is my guilt since my ticket description was faulty. Sorry for this. Please check the appearance with PlotXY. You can use it to create plots, or consider the enclosed images (screens.pdf). I hope that switching to a more PlotXY-like behaviour is straightforward for you.
Should be fine now. There are not prefix for v_2 and v_3 since we start from 103.
comment:18 by , 5 years ago
I changed the flag name so you need to enable the feature again in the settings.
comment:19 by , 5 years ago
Replying to adeas31:
I removed the words and added prefix letters to actual name in legend rather than on axes.
Very good! this is how I expected the plots to be
I believe we should have a different ticket for it.
Following your suggestion I opened #7406 for this. I see that you've already used greek-mu for prefixes, so the new ticket now refers only to Greek-Omega in plots and diagrams.
Is now from femto till peta. The deeper prefixes are also possible if needed.
I think this is ok. Deeper prefixes are so uncommon that people (including me) could get confused by them.
Should be fine now. There are not prefix for v_2 and v_3 since we start from 103.
I am 90% satisfied with new version. I see that v_3 has the prefix, and I like this. I think that a fine tuning is needed, in such a way that v_2 is shown in mV, and the like for smaller signals: v_5 in mu-V (I don't have greek letters here) v_8 in nV, etc.
I explain my rationale. Try to read v_2 in today's version: the reader will mentally convert 0.005 on the scale into 5 microvolt, 0.015 into 15 microvolt.
So, better to do us the job on behalf of him, and show the result directly in the most natural unit.
For v_large and v_small I like more the solution I adopted in PlotXY, but this is outside this ticket. The OMEdit solution is good, it is how most programs do, but let me be proud of my work, for using the power-of-ten only once on the axes for me is much better, since avoids spoiling useful desktop space.
comment:20 by , 5 years ago
Replying to adeas31:
@ceraolo how to plot parameters in plotxy tool?
There is a small button left of the button named "A <->Z".
Its symbol is "<-" (in my intention it should mimic a left arrow)
Note that PlotXY Modelica support is not complete: it shows only the signals actually written in the mat file, not aliases. It does not use variable trees.
follow-up: 23 comment:21 by , 5 years ago
I am 90% satisfied with new version. I see that v_3 has the prefix, and I like this. I think that a fine tuning is needed, in such a way that v_2 is shown in mV, and the like for smaller signals: v_5 in mu-V (I don't have greek letters here) v_8 in nV, etc.
I explain my rationale. Try to read v_2 in today's version: the reader will mentally convert 0.005 on the scale into 5 microvolt, 0.015 into 15 microvolt.
So, better to do us the job on behalf of him, and show the result directly in the most natural unit.
OMEdit solution is based on reading the lower and upper bounds of the axes and finding the right multiple of 10 and then adding this as prefix to the existing units. The multiple of 10-2 is ignored but I can consider it in as case of 10-3. And when you say microvolt you meant millivolt, right?
For v_large and v_small I like more the solution I adopted in PlotXY, but this is outside this ticket. The OMEdit solution is good, it is how most programs do, but let me be proud of my work, for using the power-of-ten only once on the axes for me is much better, since avoids spoiling useful desktop space.
True but plotXY doesn't use power-of-ten when two signals have different units, rigth?
There is a small button left of the button named "A <->Z".
Its symbol is "<-" (in my intention it should mimic a left arrow)
Yes, that I discovered already. So parameters are just shown as value and can't be plotted?
comment:22 by , 5 years ago
OMEdit solution is based on reading the lower and upper bounds of the axes and finding the right multiple of 10 and then adding this as prefix to the existing units. The multiple of 10-2 is ignored but I can consider it in as case of 10-3.
As I said, it is a good work. If you agree with my evaluation that v_2 should have mV (not microvolt, my mistake) you can just do a second pass so that when both bounds are below 0.1 you make a correction of the prefix and labels
True but plotXY doesn't use power-of-ten when two signals have different units, right?
when they have different units, power-of-ten is a good choice.
PlotXY uses power-of-ten for single and multiple variables with different units of measure when in Program Options one unchecks "automatically assign units to known variables".
When that option is checked and a plot of variables with different units of measure is requested, PlotXY does differently, but I don't see special advantages over power-of-ten (see what happens with TestUnitMultiples3)
Yes, that I discovered already. So parameters are just shown as value and can't be plotted?
yes, for two reasons:
- since they are always constant I don't see much use of plotting them
- the internal architecture of PlotXY to list parameters as normal variables that can be plotted would require allocating memory to them as if they were ordinary variables. I did not see the rationale for adding this memory consumption.
I suppose that OMEdit does not allocate arrays to parameters right?
PlotXY was designed with memory and speed efficiency in mind. For instance, it plots significantly faster than OMEdit. This has an impact on the user experience with large variables. I made a comparison with a one-million point variable between PlotXY and OM. The plotting times for a single variable (from the same mat file) were 25 ms and 5.5 s respectively, on the same laptop.
5.5 s is ok nowadays, but PlotXY gave a real edge when computers were two or three orders of magnitude slower than today's.
However, PlotXY is not adequate for plotting from production Modelica outputs, mainly because it does not list any alias, and therefore the user should envisage himself which variable is equivalent to what. I could very easily add the full list of output variables, allocating memory for all of them (and probably I'll do). More complicated would be to list alias without allocating space to them, except those to be plotted.
Another feature of PlotXY that sooner or later I would like to see in OMEdit is the possibility to create new variables. Try for instance to click in a cell in column with hash, after loading output from TestUnitMultiples3. You can require for instance the sum of i0+i1+i3 using the formula v2+v3+v4 (here v stands for variable) or i02 + i12 using the formula v2*v2+v3*v3 or abs(i1) using abs(v3), and so on.
by , 5 years ago
| Attachment: | TestUnitMultiples3.mo added |
|---|
follow-up: 24 comment:23 by , 5 years ago
Replying to adeas31:
OMEdit solution is based on reading the lower and upper bounds of the axes and finding the right multiple of 10 and then adding this as prefix to the existing units. The multiple of 10-2 is ignored but I can consider it in as case of 10-3.
As I understand, the largest number on the y-axis should be larger than 1 and smaller than 1000.
@ceraolo, do I get it right?
Also, on my Windows 10 PC, the fonts used for the variable names and the units have a bad resolution - in fact, the micro prefix is unreadable. I have an HD screen, so I guess that shouldn't be the case. I attached an example
by , 5 years ago
comment:24 by , 5 years ago
Replying to casella:
Replying to adeas31:
OMEdit solution is based on reading the lower and upper bounds of the axes and finding the right multiple of 10 and then adding this as prefix to the existing units. The multiple of 10-2 is ignored but I can consider it in as case of 10-3.
As I understand, the largest number on the y-axis should be larger than 1 and smaller than 1000.
@ceraolo, do I get it right?
I think there's some margin on personal taste for this.
Personally, I like how v_1 is rendered with the present version, the numerical labels going from -0.15 to 0.15 V. But between -150 and 150 mV would be also ok for me.
As I said, the labels for v_2, between -0.015 and 0.015 are not optimal anyway.
Also, on my Windows 10 PC, the fonts used for the variable names and the units have a bad resolution - in fact, the micro prefix is unreadable. I have an HD screen, so I guess that shouldn't be the case. I attached an example
On a PC with 1920x1200 "micro" looks good. On a laptop 1920x1080 it is very bad. Obviously, as @casella points out, we should aim also to p1080 screens (smaller's can be probably left out nowadays).
So, a little increase in legend font size is advisable (currently it is lower than axis labels'). This could have, however, unfavourable side effects on long legends within small plots. What about switching also to a proportional font, e.g. the one used for "time(s)"? It seems to me that the issue is due to a combination of small resolutions and the used font family.
With a good proportional font we maybe can afford a bit larger font size, while having the same or smaller length of long legends.
follow-ups: 26 27 comment:25 by , 5 years ago
The fonts are fully customizable from the setup of the current plot window or if you want to retain font and use it the same for all plot windows then change it in OMEdit Plotting settings.
I guess the issue is due to wrong display of micro symbol. @ceraolo how are greek characters printed in plotXY? Unicode?
comment:26 by , 5 years ago
Replying to adeas31:
The fonts are fully customizable from the setup of the current plot window
It seems to me that you've to stick to courier. Do you really prefer having courier just for the legend, while the other text in the plot is a proportional font?
I guess the issue is due to wrong display of micro symbol. @ceraolo how are greek characters printed in plotXY? Unicode?
yes:
c=0x03BC;
As you can see from a screenshot that I include, it shows well also with a much smaller size than OMEdit's.
by , 5 years ago
| Attachment: | screen.png added |
|---|
comment:27 by , 5 years ago
Replying to adeas31:
The fonts are fully customizable from the setup of the current plot window
This is nice, but I guess the default should be a good one. As the screen.png image shows clearly, the default font looks very much as something out of a PC monitor of the 80's: grainy, pixelated, with no anti-aliasing.
The font used for the numbers on the axes looks very good from this point of view, while the font for the Time (s) label also looks quite grainy. Couldn't we use the same font used for the axes number everywhere?
I see no reason why we should use a monospace font for the legend. In fact, using a proportionally spaced font would allow to fit more information in the same space.
follow-up: 30 comment:28 by , 5 years ago
| Milestone: | 2.0.0 → 1.18.0 |
|---|---|
| Resolution: | → fixed |
| Status: | new → closed |
A default monospaced font is used for legend since the normal font can't display the - sign used for toggled signals. Courier can be used instead of default monospaced font.
See PR#7410. Fixes,
- Display of greek micro symbol
- Uses milli for v_2 i.e., for 10~-2.
- Use Courier font for legend. The display of word
vsused for plot parameteric is not nice in italic with courier font so I changed from italic to bold.
comment:29 by , 5 years ago
| Resolution: | fixed |
|---|---|
| Status: | closed → reopened |
The micro character now shows bad also in a screen where it used to work (Screen242.png).
I still think that the use of courier is not the best choice.
My experience is that exoteric unicode characters are not well supported with all the font styles. That's a good reason to choose the default, which should be the best supported.
There must be some trivial reason for which with the default style did not show the minus sign in your case. After all it is just an ASCII character, and should not give raise to issues.
by , 5 years ago
| Attachment: | screen242.png added |
|---|
comment:30 by , 5 years ago
Replying to adeas31:
A default monospaced font is used for legend since the normal font can't display the
-sign used for toggled signals.
This is weird. There are - signs on the y-axis values, which are using a very nice font.
comment:33 by , 5 years ago
| Resolution: | → fixed |
|---|---|
| Status: | reopened → closed |
comment:34 by , 5 years ago
| Priority: | high → blocker |
|---|---|
| Resolution: | fixed |
| Status: | closed → reopened |
| Version: | v1.13.2 → 1.18.0-dev |
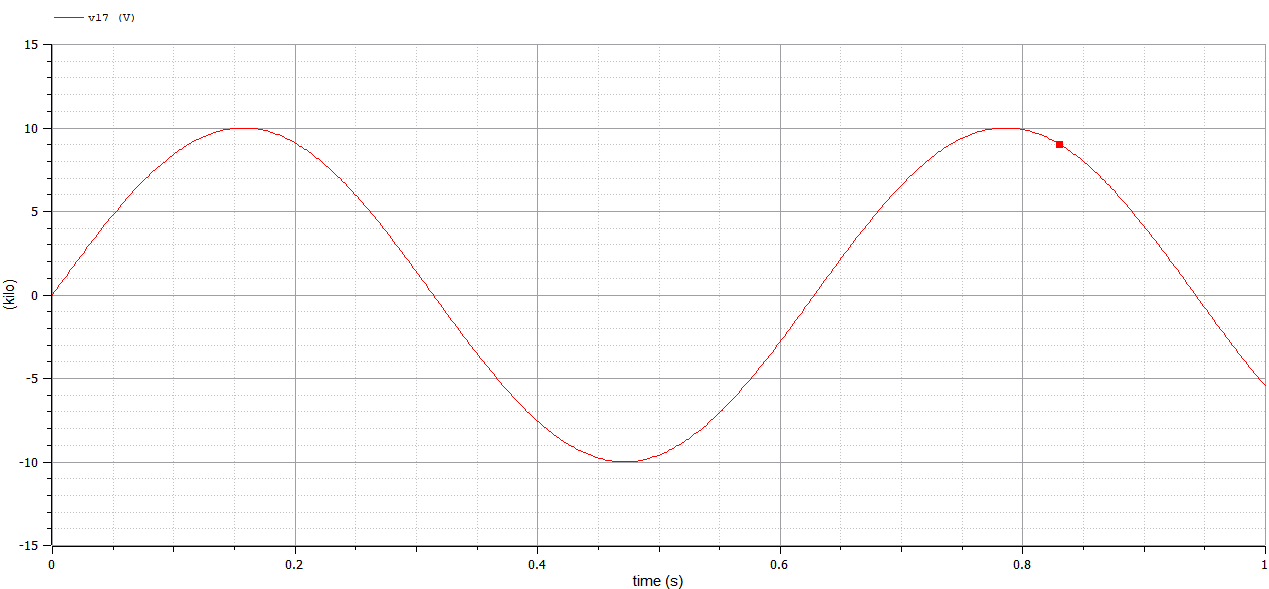
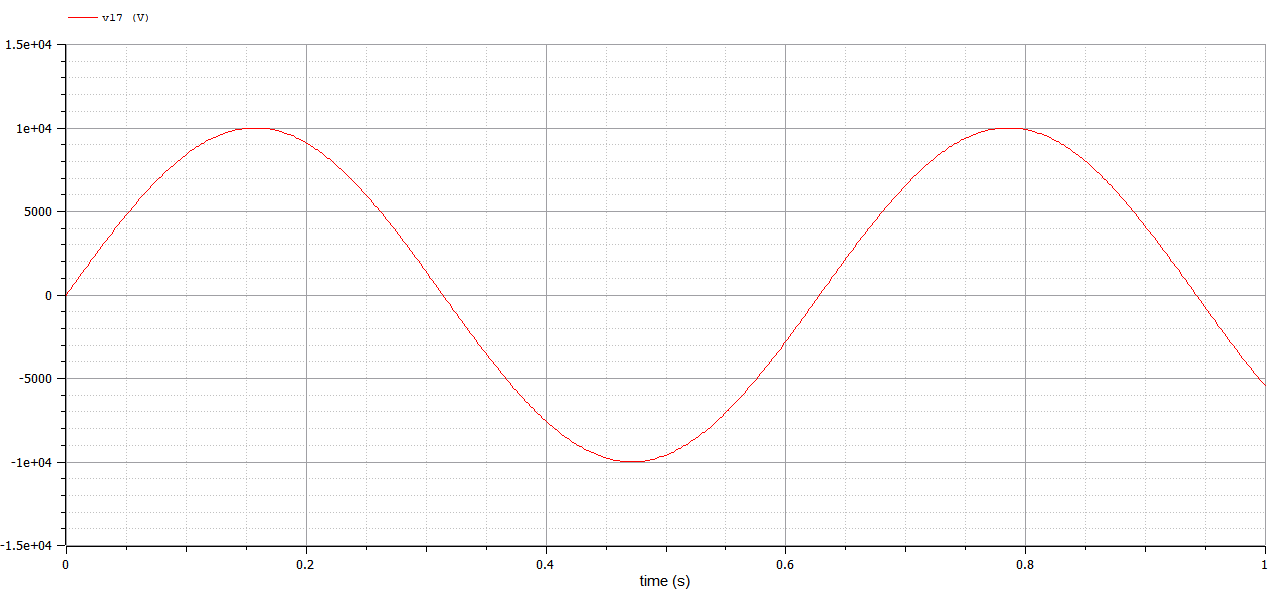
@adeas31, I just realized that there is a special case which is really not good.
Consider this test model
model Test
  Real x = sin(10*time);
  Real y = 0.0015*sin(12*time);
  Real z = 1.6e6*sin(15*time);
end Test;
If you plot y, what you see is a sinusoid with a range of 1.5, and the legend says y(m).
This is totally confusing, because one would interpret "m" as "meters", not as "milli". If you plot z, you get y(M), which also makes me scratch my head.
Now, "milli (m)" and "mega (M)" are prefixes, so by definition they must be followed by a unit; they make no sense by themselves.
Please make sure that prefixes are only used in plots for variables which do have a unit. In case unit="", the whole prefix feature should be disabled.
We should try to get this done for the 1.18.0 release.
comment:35 by , 5 years ago
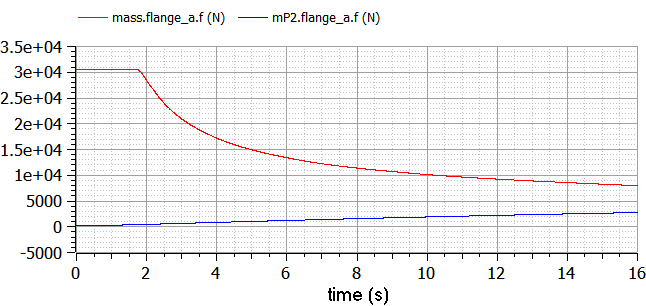
There is a case in which the algorithm does not work well.
See BadScale.png. Obviously, in this case kN should have been used.
Maybe to fix this is simple enough?
by , 5 years ago
| Attachment: | BasScale.png added |
|---|
comment:39 by , 5 years ago
Replying to adeas31:
@ceraolo can you also share a test model for bad scale?
I cannot replicate that plot.
So, for the time being, forget about it. In case I come across similar issues, I'll let you know, and supply full details to reproduce them.
comment:41 by , 5 years ago
The prefix feature is only used when all the plotted variables has a unit.
comment:45 by , 5 years ago
| Resolution: | fixed |
|---|---|
| Status: | closed → reopened |
Points 5 and 6 are still missing.
BTW, I have a case with three inertias. One of them takes rad/s, and the others rpm, making comparisons crazy. Solving point 5 solves also this,
comment:46 by , 5 years ago
| Milestone: | 1.18.0 → 1.20.0 |
|---|
@ceraolo, @adeas31 will be off for a while, I guess he'll manage for the next release.
comment:47 by , 4 years ago
@adeas31, any news on points 5 and 6?
I would really appreciate seeing them fixed. What I mentioned in my comment 45 continuously pops up to me!
Thank you.
comment:48 by , 3 years ago
| Milestone: | 1.20.0 → 1.21.0 |
|---|---|
| Resolution: | → fixed |
| Status: | reopened → closed |
I support this proposal. In fact, Modelica provides a framework for the proper use of units, I think that if the proper displayUnit is not selected, having the tool making an educated guess would be really nice.