Opened 6 years ago
Closed 6 years ago
#5952 closed defect (fixed)
Scaling of matching and sorting for simulation badly deteriorated from v.1.15
| Reported by: | Francesco Casella | Owned by: | Karim Adbdelhak |
|---|---|---|---|
| Priority: | blocker | Milestone: | 1.16.0 |
| Component: | Backend | Version: | |
| Keywords: | Cc: | Andreas Heuermann, Lennart Ochel, tobias.krenz@…, Martin Sjölund |
Description
The scalability of the backend was greatly improved starting from v.1.9. About three years ago, when 1.12 was released, most serious issues were solved, and a few corner cases remained, which are collected in #4146. I since then stopped watching those results frequently, but I now realize that was a mistake :)
I am convinced that spending more resources to streamline the scalarized backend further would not be a good idea, and we should rather try to get ASAP to an efficient vectorized backend and code generation framework, which will be way more efficient, see #5917. However, we need to avoid regressions.
Let me focus on a specific model of the ScalableTestSuite, Electrical.DistributionSystemAC.ScaledExperiments.DistributionSystemLinearIndividual_N_XX_M_XX
If you check the newInst master branch report, and look for the time spent by matching and sorting, you find the following results
| N | M | Time |
|---|---|---|
| 10 | 10 | 2.7 |
| 14 | 14 | 9.3 |
| 20 | 20 | 41.6 |
| 28 | 28 | 163 |
This is bad, matching and sorting in this case used to scale up much better. In fact, we can see that easily via the cross-version report, scroll down to ScalableTestSuite_noopt. The time spent by matching and sorting for the N_28_M_28 case are reported here for your convenicence
| ver | Simulation | Initialization |
|---|---|---|
| 1.12 | 0.40 | 0.49 |
| 1.13 | 0.43 | 2.95 |
| 1.14 | 0.43 | 0.48 |
| 1.15 | 2.53 | 0.47 |
| master | 150 | 0.50 |
What is interesting is that the time to perform matching and sorting for the simulation problem went through the roof with some commits on the 1.16.0-dev master branch, some of which were apparently back-ported to 1.15 as well, while the time to perform it for the initialization problem (which is a superset of the former) remained the same.
I guess some of the improvements related to tearing, state selection, MSSS, and the like accidentally introduced some operation that improperly scales with O(N2). Sometimes something as trivial as traversing a tree or a list in the wrong direction can lead to that. With small models, it doesn't make any difference, but as the size grows, this single operation will eventually dominate the time spent by the backend, if all other steps grow with a lower exponent.
@Karim, @AnHeuermann, would you mind having a look? You know what has been done there, so it's probably fairly easy for you to figure out what are the bad commits.
This is a rather bad regression, we should fix it ASAP and also back-port it to 1.15, since that was already somewhat affected, though not that badly.
Please consider the recommendations written in #4362 every time you push some code to the master branch. We currently do not have any automatic check against even serious scaling performance degradations, these must be checked manually by inspecting the reports of the larger testsuite. Maybe you don't need to do it every time, but it would be good to compare the ScalableTestSuite reports with the master branch and with the latest stable release every now and then, to check for significant regressions on larger models.
Attachments (2)
Change History (23)
comment:1 by , 6 years ago
comment:3 by , 6 years ago
Makes perfect sense. The situation is very similar to what happens with tearing, which needs to be disabled on large systems.
BTW, in most Modelica models strong components of such large size are unlikely. The two exceptions that come to my mind are large impedance networks (as in the case mentioned here) and large incompressible fluid networks. In both cases, large or very large systems with 1000's or possibly 10,000 or 100,000's of equations can show up. No index reduction required here, so the lack of the ASSC algorithm shouldn't be such a big deal.
I'll check the results on the testsuite tomorrow, thanks for the quick reaction!
comment:5 by , 6 years ago
Indeed. I restarted the newInst job (which is my reference), since yesterday it ran right before your commit.
follow-up: 16 comment:6 by , 6 years ago
The results of the newInst test are markedly improved.
I compared the performance of matching and sorting of DistributionSystemLinearIndividual_N_XX_M_XX using v.1.12 and master
| N | M | Sim v.1.12 | Init v.12 | Sim master | Init master |
| 10 | 10 | 0.38 | 0.06 | 0.06 | 0.07 |
| 14 | 14 | 0.10 | 0.12 | 0.14 | 0.15 |
| 20 | 20 | 0.21 | 0.26 | 0.29 | 1.07 |
| 28 | 28 | 0.40 | 0.49 | 0.59 | 0.62 |
| 40 | 40 | 0.91 | 3.76 | 3.05 | 1.28 |
there are a few glitches, but overall I'd say the situation is now fine w.r.t. scaling.
If I look at the overall newInst report of the ScalableTestSuite, I still see backend times starting to scale superlinearly for the larger systems (before timeouts are triggered). This is due to symbolicJacobian scaling as O(N3), which is an old story, see #3781.
@Karim, could you please merge the fix also into 1.15 and then close this ticket?
by , 6 years ago
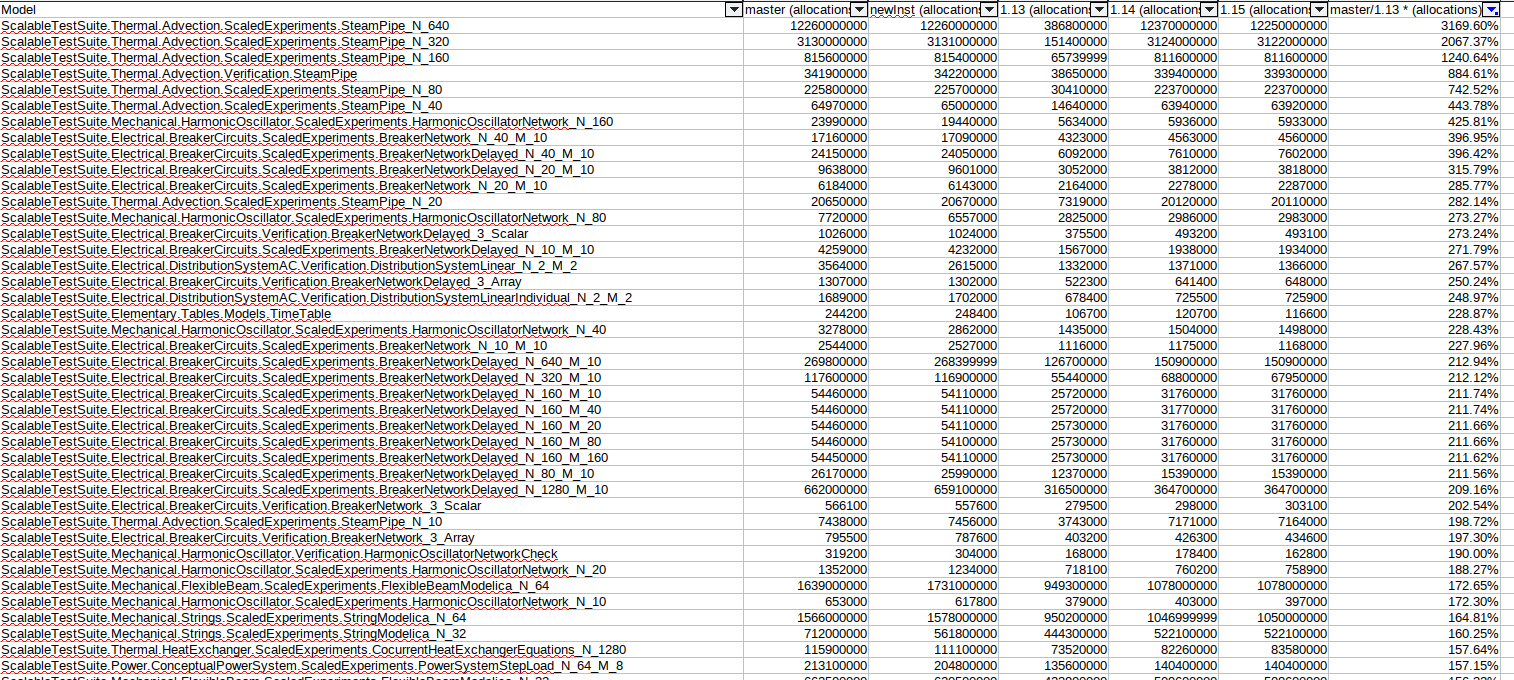
| Attachment: | Selection_2020-05-14-01.png added |
|---|
Memory allocated for sorting+matching, sorted by ratio of master/1.13
follow-up: 9 comment:7 by , 6 years ago
I created a script to look through the data of all sorting+matching, and there are some models that still look to perform very bad compared to 1.13:

by , 6 years ago
| Attachment: | matching.ods added |
|---|
Raw data for sorting+matching times and allocations
comment:8 by , 6 years ago
There are almost no models using less memory allocations than in earlier versions, so something has changed...
comment:9 by , 6 years ago
Replying to sjoelund.se:
I created a script to look through the data of all sorting+matching, and there are some models that still look to perform very bad compared to 1.13:
I will have a look at that. I added ASSC to the matching, so it is expected to have more memory allocations. I removed another backend module which did something similar before.
Maybe i have to lower the max size even more, i will analyze it.
Also the backport has some merge conflicts, could take some time until i have time for that!
comment:10 by , 6 years ago
Thank @sjoelund.se for the analysis, thanks @Karim for looking at it. I guess 1.15.0 is not coming anytime soon (alas), so the backport is not super-urgent, but I think we should really not release 1.15.0 with a regression.
On the other hand, we switch to time-based release, with 1.16.0 expected in 2 months, so either @adrpo gets through his job in the next few days, or I guess we'll have to skip 1.15.0 and release 1.16.0 directly.
follow-ups: 12 13 14 comment:11 by , 6 years ago
BTW I checked the .ods file, but I only saw memory allocation, not time.
Also, I'm not sure what "memory allocation" actually means - does it mean it is not released until the end of the process? Otherwise, if memory is allocated and deallocated but the time does not grow, do we actually care?
follow-up: 15 comment:12 by , 6 years ago
Replying to casella:
BTW I checked the .ods file, but I only saw memory allocation, not time.
Also, I'm not sure what "memory allocation" actually means - does it mean it is not released until the end of the process? Otherwise, if memory is allocated and deallocated but the time does not grow, do we actually care?
afaik it refers to general memory allocation (not to unreleased allocation) which is an indicator for inefficient code i guess. But as i said, i moved an entire module which was isolated before to the matching module so it is expected. Also it has to allocate quite the amount of primitive integer arrays which drives up the count.
If there is no reduction in overall time it should be fine, but it might still be worse for some cases. Where can i find the results?
follow-up: 17 comment:13 by , 6 years ago
Replying to casella:
BTW I checked the .ods file, but I only saw memory allocation, not time.
Unhide the columns
comment:14 by , 6 years ago
Replying to casella:
Also, I'm not sure what "memory allocation" actually means - does it mean it is not released until the end of the process? Otherwise, if memory is allocated and deallocated but the time does not grow, do we actually care?
Time spent is usually proportional to number of allocations. But time reported for each module can be misleading since it might garbage collect in only one of the compared OM versions.
comment:15 by , 6 years ago
Replying to Karim.Abdelhak:
If there is no reduction in overall time it should be fine, but it might still be worse for some cases. Where can i find the results?
This one?
https://trac.openmodelica.org/OpenModelica/attachment/ticket/5952/matching.ods
It was generated by this script (which you can modify; I can give you access to the files as well if you want):
https://github.com/OpenModelica/OpenModelicaLibraryTesting/blob/master/compare-phases-download.py
I will have a look at that. I added ASSC to the matching, so it is expected to have more memory allocations. I removed another backend module which did something similar before.
Which module was it that was removed? I could create a spreadsheet for that as well to see if anything changed.
comment:16 by , 6 years ago
Comparing that SteamPipe 640 total allocations needed throughout the entire translation:
| Version | Total allocations | Total time | Sorting+Matching allocations | Sorting+Matching time |
| 1.12 | 7.8 GB | 20s | ||
| 1.13 | 7.3 GB | 22s | ||
| 1.14 | 19.4 GB | 117s | ||
| 1.15 | 19.3 GB | 113s | ||
| newInst | 16.3 GB | 152s | ||
| master | 19.6 GB | 113s | 12.4 GB | 91s |
So you can see that the entire regression is the time+memory sorting+matching takes.
comment:17 by , 6 years ago
Replying to sjoelund.se:
Replying to casella:
BTW I checked the .ods file, but I only saw memory allocation, not time.
Unhide the columns
You naughty boy :)
comment:18 by , 6 years ago
| Milestone: | 1.15.0 → 1.16.0 |
|---|
Release 1.15.0 was scrapped, because replaceable support eventually turned out to be more easily implemented in 1.16.0. Hence, all 1.15.0 tickets are rescheduled to 1.16.0
follow-up: 20 comment:19 by , 6 years ago
@Karim, have you made up your mind on how to deal with this issue for the 1.16.0 release?
comment:20 by , 6 years ago
Replying to casella:
@Karim, have you made up your mind on how to deal with this issue for the 1.16.0 release?
We discussed this in a dev meeting i think. The basic problem was the ASSC algorithm which scales badly, but that is expected. I put a restriction for a maximum of 200 equations on the algorithm, but in some cases that still leads to a major increase in compilation time since everything else is trivial. The artificial (and not really practically relevant) loops introduced by the scalable testsuite are trivial in all other regards so one can really see the difference here.
We decided on not changing that as far as i remember, because the problem should not affect anything else. We can put lower restrictions for ASSC on the tests for these models, that should suffice.
--maxSizeASSC=50 or even --noASSC since the basic analysis also takes some time. Not really much though, it depends on what we really want to test here.
comment:21 by , 6 years ago
| Resolution: | → fixed |
|---|---|
| Status: | new → closed |
Ok, so we can close this ticket, and I may take care of the ScalableTestSuite afterwards
Part of the issue seems to be due to the ASSC algorithm. I guess i will have to skip it for too big systems since it is somewhere near
O(n^2)(with some constant factor~10which we can ignore i guess).I tested the
N=14, M=14and it made a difference of 10 seconds of a total of 13 seconds spend in the backend. The analyzed strong component contained 800 linear integer coefficient equations which had to be analyzed.Since most relevant loops which have to be converted with this algorithm are rather small, i have implemented a max size flag for the algorithm which is capped at 200 by default. You can change it with
--maxSizeASSC=.If the PR runs fine we will push it and see what impact it has: PR866