Opened 6 years ago
Last modified 5 years ago
#6233 new defect
Tooltip shows wrong unit
| Reported by: | Owned by: | Adeel Asghar | |
|---|---|---|---|
| Priority: | high | Milestone: | |
| Component: | OMEdit | Version: | 1.16.0 |
| Keywords: | Cc: |
Description
Consider the following example of an electric circuit using a ramp voltage:
model ParametricPlotToolTip
  Modelica.Electrical.Analog.Basic.Ground ground annotation(
    Placement(visible = true, transformation(origin = {-80, -50}, extent = {{-10, -10}, {10, 10}}, rotation = 0)));
  Modelica.Electrical.Analog.Basic.Resistor resistor(R = 100)  annotation(
    Placement(visible = true, transformation(origin = {-40, 0}, extent = {{-10, -10}, {10, 10}}, rotation = -90)));
  Modelica.Electrical.Analog.Sources.RampVoltage rampVoltage(V = 100, duration = 1)  annotation(
    Placement(visible = true, transformation(origin = {-80, 0}, extent = {{-10, -10}, {10, 10}}, rotation = -90)));
equation
  connect(rampVoltage.n, ground.p) annotation(
    Line(points = {{-80, -10}, {-80, -40}}, color = {0, 0, 255}));
  connect(rampVoltage.p, resistor.p) annotation(
    Line(points = {{-80, 10}, {-80, 30}, {-40, 30}, {-40, 10}}, color = {0, 0, 255}));
  connect(resistor.n, ground.p) annotation(
    Line(points = {{-40, -10}, {-40, -30}, {-80, -30}, {-80, -40}}, color = {0, 0, 255}));

annotation(
    uses(Modelica(version = "3.2.3")));
end ParametricPlotToolTip;
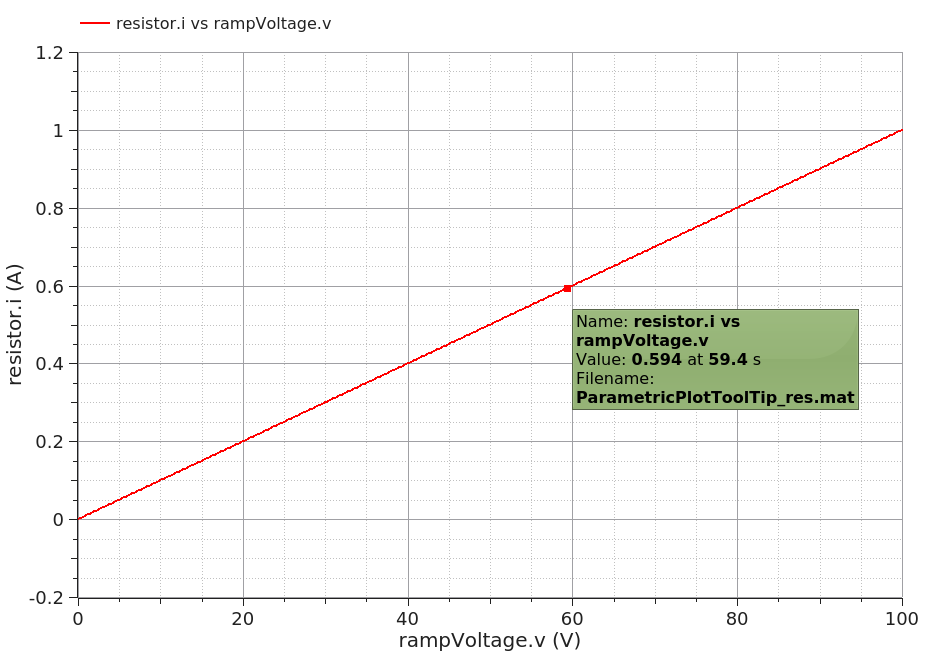
Run the simulation and create a parametric plot with rampVoltage.v on the horizontal axis and resistor.i on the vertical axis. When moving the mouse pointer onto the curve, a tooltip is shown indicating the actual point. However, the horizontal quantity is show in seconds (s) instead of Volt (V).
Attachments (1)
Change History (5)
by , 6 years ago
| Attachment: | ToolTip.png added |
|---|
comment:1 by , 6 years ago
For a parametric plot it however makes sense to show
- horizontal value
- vertical value
- time value
comment:2 by , 6 years ago
| Milestone: | NeedsInput → 1.17.0 |
|---|
comment:3 by , 5 years ago
| Milestone: | 1.17.0 → 1.18.0 |
|---|
Retargeted to 1.18.0 because of 1.17.0 timed release.
Note:
See TracTickets
for help on using tickets.
Tooltip showing the wrong unit (s) instead of Volt (V)